Data Teams as Gatekeepers to Unlock Brownfield Cleanups

Environmental data teams methodically confirm cleanup levels and visualize the 'cleanup finish line' with the regulatory criteria and client end goals

What is the measure of ‘clean’ at brownfield sites? Before any digging of contaminated dirt or treatment of contaminated groundwater, there is much upfront work by regulators and project teams – chemists, data analysts, geologists, engineers, and more – to determine the appropriate cleanup levels to use for a given site. The cleanup levels are the north star that every brownfield cleanup team steers by.

To Succeed, Be Sure What ‘Clean’ Looks Like

Aspect’s environmental data team regularly keeps the finger on the pulse of regulatory databases and uses tools – such as the open-source programming language R – to streamline brownfield cleanup projects.

Using R to automate screening level updates allows project teams to:

  • Make changes quickly and confidently

  • Minimize the risk of errors and omissions

  • Provide much-improved process transparency

  • Streamline communications across the project team

Keeping up on the best available science gives project managers greater assurance that their sites are being appropriately measured against regulatory criteria, providing a smoother path forward in the management and remediation of contaminated sites.

A Peek into Regulatory Data World with CLARC

CLARC is the Washington State Department of Ecology’s (Ecology) Cleanup Levels and Risk Calculation spreadsheet that is the basis for calculating cleanup levels under Ecology’s Model Toxics Control Act (MTCA). MTCA is Washington state’s cleanup rule which governs over 13,000+ known or suspected contaminated sites. CLARC is a key measure of what defines success at these cleanup projects and a living document that is maintained and updated by Ecology, as needed, with major updates every six months to align with changes to state and federal regulatory (e.g., US Environmental Protection Agency (EPA)) criteria.

Aspect engineer evaluating a vapor intrusion system at Art Brass Plating – a South Seattle cleanup site. The measure of success for these systems — and projects — rely on knowing the correct and up-to-date cleanup level criteria

The data tables in CLARC provide the various input parameters used to calculate screening levels for a huge array of chemicals in soil, groundwater, surface water, soil gas, and air—as well as the resulting calculated cleanup level values themselves. The calculated values are routinely used by remediation project managers to screen analytical results (from samples collected in the field) against federal, state, or other regulatory thresholds.

What is R and How Does it Accurately Automate Away Manual Data Entry?

R is an open-source software environment used for statistical computing and graphics. Recently, Aspect’s data team wrote a package of R code to use CLARC’s input parameters to calculate a suite of specific screening levels. The same code can be run any time the input values in CLARC are updated, generating quality assurance tables to alert Aspect’s data team of potential issues, and providing summary tables for Aspect project managers to review cleanup level changes and consider their potential impact to their various environmental sites.

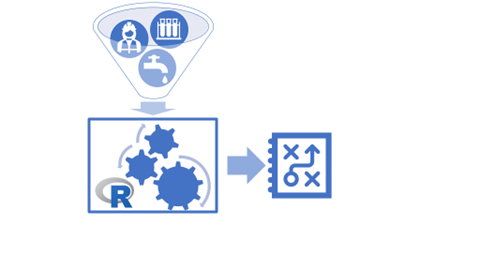
Various input parameters, including regulatory requirements, chemistry, site use, human safety and environmental quality are entered into our custom R tool to make and maintain a reliable, reproducible metric set for project success

Since there are usually screening levels for hundreds of different analytes at remediation cleanups  – e.g., petroleum and diesel, arsenic, tetrachloroethylene and more – when the CLARC database is updated by the regulator, it can be difficult to see if there have been any changes and which analytes may have been affected.

Aspect uses the industry standard EQuiS environmental data management system. The R tool helps us better use EQuIS to manage and screen environmental data against cleanup levels. Before using R, preparing CLARC-based screening and cleanup levels for upload to EQuIS required tedious data wrangling in Excel and institutional knowledge of what analytes should be compared to which screening levels. With R, the process involves little more than a click of a button

Data Problem Solving that Makes Remediation Easier

R simplifying the complexity of the brownfield cleanup level process

Brownfield remediation cleanups require imagining a range of scenarios for the future use of a ‘clean’ property. Will the site be used for residential, commercial, or industrial purposes? What pollutants are present and where? It all starts with the cleanup level criteria.

Overall, this work by Aspect’s data team – who are meticulous at knowing the state-of-the-science regulatory criteria – ensures Aspect’s project teams have the correct screening or cleanup levels based on the most current toxicity guidance, which helps avoid rework later on in the process and saves time and money for the client.

Lea Beard Talks Tableau and EQuIS at ICEDM in Oregon

Aspect’s Lea Beard was invited to speak at the 7th Annual International Conference for Environmental Data Management (ICEDM) this week in Oregon.  Lea’s talk is on using environmental data management systems such as EQuIS in conjunction with powerful graphical analytics systems like Tableau to easily produce reliable, beautiful insights into data.


Environmental Data Management Done Right: EQuIS in Action

Aspect’s Data + Mapping team uses time-saving tools to streamline our data analysis and processing to inform conclusions, design, and reporting—at the center of which is the environmental data management system EQuIS. Having long been leaders in the field of environmental chemistry data management, we have recently migrated from home-built, custom database systems to this industry standard. Our expertise with this powerful software has been bolstered by Senior Staff Data Scientist Lea Beard, who joined Aspect last summer. She is an EQuIS expert who turns her deep analytical chemistry and data management skills into efficiencies and insights for Aspects project teams and clients.

Why we use EQuIS:

  • It is reliable and stable, ensuring the integrity of our clients’ valuable data.
  • It helps us to process, review, manage, and analyze data as rapidly as our projects move.
  • It enables us easily tailor reporting outputs to the nuanced needs of a project.
  • It ensures adherence to standards and helps us to maintain consistency across projects.
  • It safeguards our data’s compliance with environmental regulatory standards.

Created by EarthSoft, EQuIS is optimized to handle a broad-range of environmental data—particularly environmental chemistry data. EQuIS gives us the “brain” to formulate answers to the questions its users may ask, such as:

  • How many fish passed through this culvert last year?
  • To what extent have the concentrations of chlorinated solvents in groundwater responded to the remediation system operation?
  • Was the Reporting Detection Limit for Lead low enough to meet the Quality Assurance Project Plan?
  •  What were water level elevations in this monitoring well network from 2010 to 2015?

Having this framework already in place saves us and our clients time and money that would otherwise be spent building or customizing software to meet ever-changing needs. EQuIS also contains built-in solutions for common problems encountered in environmental reporting. It’s been put to the test by a wide cross-section of users—consultants, public agencies, corporations, laboratories—who have contributed their feedback and worked out bugs as they go. With a diverse group of users informing how it works for them, EQuIS is able to keep up with the state of environmental reporting.

Case Study in How EQuIS Simplifies Our Data Collection

Our staff heads out to a project site, tablet loaded with Fulcrum in hand, and begins to collect data. When the day is done, they send samples to the lab for analysis. Taking the field observations and measurements from Fulcrum and the analytical results from the lab, Lea feeds these two data sets alongside one another into EQuIS. With these normally separate datasets stored together in one spot, EQuIS makes it easy to access and search. Automated alerts and reporting based on preset parameters (perhaps a particular contaminant level has been detected or exceeded) means that project teams can make timely decisions about their next round of data collection or further investigation/inquiry. Reversing the direction of the data, Lea can then feed those results back into Fulcrum, sending it out to the team in the field, ensuring they have the most up-to-date information at the site. In the past this information exchange would have taken a week, but with EQuIS and Fulcrum, it takes mere hours.

EQuIS weaves together the data streams and creates meaningful output.

A Helping Hand Sets Clients on the Right Data Management Path

While EQuIS has the power and flexibility to make managing data easy, it can be a bit daunting to learn and implement. Lea helps guide clients through the set-up process – deciding on reference values, figuring out which lab electronic data deliverable formats to use, building reporting standards – forming the framework of their ongoing data management needs. From there, Aspect can help clients create software customizations to make summing groups of analytes (such as polychlorinated biphenyls) straightforward and reproducible, and offer assistance on making data easy to export into Ecology’s Environmental Information Management (EIM) database. Our in-house experience with EQuIS allows us to help clients tell their project’s story clearly.

Having someone like Lea at the helm of a program like EQuIS allows us to efficiently collect, manage, and report on data, ensuring that the rest of our team can focus on what they’re best at: science and strategic advice for our clients.